Monday, December 23, 2019

State Data: 8 in 10 Public Districts Outperform Private, Voucher Schools in the Same Community


Image result for edchoice ohio

One of the remnants of House Bill 1 -- the landmark school funding and policy legislation during which I served as Chairman of the Primary and Secondary Education Subcommittee of the House Finance and Appropriations Committee -- was a provision that required all EdChoice voucher students to be tested the same as public school students.

This provision has allowed for there to be several years of testing data for some EdChoice students. The results are only posted if a certain number of students at a private school take vouchers. And only the EdChoice students at the private schools take the tests.

However, it is useful, I feel, to compare how students taking vouchers do vs. those who do not. The results are interesting. But there are several caveats:


  1. The test results for voucher students only calculate the proficiency rate. Nothing on student growth. And nothing about how much over proficiency the students score. For example, public school students can rate Proficient, Accelerated or Advanced. But all voucher students get is whether they are proficient.
  2. There are no test results for students in private schools who do NOT take a voucher. So the results I'm about to discuss do NOT necessarily indicate how the privates are doing overall. It is simply measuring how voucher recipients do and how proficient they are on state tests.


So here's how I did this comparison using 2017-2018 school year data (the latest available), given the caveats:


  1. I looked at all private schools eligible to take EdChoice vouchers and sorted them by mailing address, then averaged their performance by that community. So, for example, I looked at the average proficiency rate of EdChoice students in private schools with a Cleveland mailing address.
  2. I then compared their overall proficiency rate with the rate of proficient or better scoring students in the public school district that contains the private, voucher school. So all EdChoice students in private schools with a Cleveland mailing address compared with the proficiency rate of all Cleveland Municipal School District students.
  3. In cases where more than one district covered the city listed in the voucher school address, I compared the proficiency scores for the voucher school (or schools) with the lower performing district that covered that private school
  4. In cases of major urban areas (Akron, Canton, Cincinnati, Columbus, Cleveland, Dayton, Toledo and Youngstown), I compared all the private voucher schools' performance with those mailing addresses with the major urban districts'. It should be noted, though, that several of these private schools are NOT in the major urban cities. They are in suburbs, but have mailing addresses in the major urban core. But I wanted to be as conservative as possible in this comparison.

Here's what I found:

  • Of the 139 school districts that contain private schools taking EdChoice vouchers, 109 had better proficiency rates than the voucher schools. That means that 78% of the time, the public school district students outperformed the private school voucher students in the same community
  • The average difference was 27 percentage points (for example, the difference between being 50% proficient and 77% proficient) -- a massive difference
  • The average difference between districts that underperformed voucher buildings was a relatively paltry 9%. So districts outperformed voucher buildings at 3 times the scale of voucher buildings outperforming districts.
  • Overall, the average proficiency rate in the public school district was 63.5%. The average proficiency rate for an EdChoice building was 44.4%
These data are especially important now that more than 7 in 10 Ohio school districts have at least one building eligible to have students take the EdChoice voucher. 


In nearly 8 of 10 cases, that student's choice to take a voucher will result in the voucher student attending a school where they are less likely to do well on state tests than the public building they left.

Given EdChoice supporters' claims that the program "rescues" kids from "failing public schools", one would think this data would give them pause. But we've known this for years -- that EdChoice does not improve student performance; it harms student achievement.

So we'll see if this new data changes any minds.

Friday, December 20, 2019

Country's Largest Federal Charter School Grant Provides 4% of the Awarded Money

Ohio's infamous Charter School federal grant application and award from 2015 will fall well short of the nation-leading $71 million it won.

The only two years grants have been doled out -- last school year and the year before -- have resulted in less than 4% of the money being given to grow high-performing charter schools.

Why?

Because there simply aren't enough high-performing charter schools to justify anything near $71 million. As I and others said at the time of the bizarre federal award.

There are 8.

That's right.

Eight charter schools that have received money from the federal grant. That's about 2 percent of all charter schools in the state.

And only $2.8 million of the $71 million granted has been given out. Now, Ohio has already told the feds that they won't be able to spend $22 million of the $71 million. But how will they give out the remaining $46 million or so that remains in the Ohio grant?

Simple.

They won't.

What a shock that a grant that was given based on misleading information given by a guy who was trying to protect the Electronic Classroom of Tomorrow (and had to resign over it) ends up in absolute disaster for taxpayers, the feds, the state, kids and families.

Go figure.

Ohio House Speaker Wants Voucher Fix as Vouchers More than Double in his County.

House Speaker Larry Householder, who famously is from Perry County -- the home of the state's school funding lawsuit -- announced at his year-end press gaggle yesterday that fixing Ohio's exploding voucher crisis will be priority No. 1 next year.

"We have failed badly as far as our report card system and our testing system in this state," he said.

That's quite an admission. And commendable. However, it has also been true forever. 

Our system has always been rigged against poor districts because as we now know, the "achievement gap" is explained exclusively as a poverty issue -- and always will be as long as it is standardized tests that states use to measure educational effectiveness. 

This isn't anything earth shattering that requires sophisticated statistical analysis. It's just good horse sense. 

Look at the list of the lowest performing school districts on state tests in 2005 and look at them today

They are the same districts.

So why is Householder so concerned about this now? I have a theory that I think will hold up: Now that this rigged report card is affecting his districts, he's starting to realize their awful impact.

What happened is that pro school choice advocates, led by their champion, state Sen. Matt Huffman, R-Lima, reached waaay out over their skis, culminating in this year's budget disaster (which we were first to point at at Innovation Ohio, and I and we had been warning about for years).

So now, districts are losing $60 million more in state aid this November to EdChoice vouchers (vouchers originally meant to "rescue kids from failing schools") than they did last November.

And over the last two years, the number of school buildings -- even in high-performing school districts like Solon, Upper Arlington and Worthington -- has skyrocketed.

While the number of buildings has climbed dramatically from about 9 percent of all school district buildings to more than 1/3 of all buildings in two years, the number of districts that now have to worry about losing state funding to vouchers has simple gone off like the Big Bang.

So now there are 424 of Ohio's 613 school districts with at least one building qualifying for vouchers. 

Last year, there were 31! That's right. In two years, the number of districts losing funding to vouchers will jump by more than 13 times!

This explosion is extraordinary and in many places a crisis. Why? Because two years ago these districts and their kids lost zero state funding to private, mostly religious schools, Now they lose money -- in some cases significant money.

See, it's not just the kids in the "failing" buildings who lose the state money that's transferred to private, mostly religious schools. It's the kids in the high-performing buildings as well. 

Because the transfer comes out of the district's state funding pot, not the offending building's. So every kid in the district loses state funding because of the transfer, not just the kids in the low-performing building. The system punishes the highest-performing kids in the highest-performing buildings just as it does the lowest-performing kids in the lowest-performing buildings.

So now kids in 70 percent of Ohio's school districts are losing state funding to private, mostly religious and completely unaccountable schools.

Remember, even pro-voucher advocates admit that the EdChoice program actually harms student achievement.

If you look at the counties where the relative shift in funding from public to private schools has jumped the most, it's all rural counties -- including Householder's home county.

As you can see, Perry is one of 12 Ohio counties who have seen their state funding to vouchers more than double between November 2017 and November 2019. Ohio has 88 total counties. 

It is these rural counties, which can't offset much state revenue loss because they raise so little on property taxes, where EdChoice state funding transfers are just killing districts. This, I think, explains Householder's urgency. It's hurting his community. 

All politics is local indeed.

There are many ways of undoing this damage. Not allowing voucher buildings in districts that are high performing overall is one. As is requiring that buildings must be low performing on more than a single report card measure before being voucher eligible. That way kids in the district don't lose state funding because a handful of kids aren't being served in a single district building.

But Householder really nailed what the heart of the issue is: the Report Card and standardized tests. So if he effectively fixes the root problem, kudos.

And while I really don't like what's happened with the voucher explosion this year, if that's what it takes for the state to once and for all put a stake through the heart of the state's rigged, unfair, inaccurate standardized-test-based accountability system? 

Well, I'll take it. 

It's about time.

Monday, December 2, 2019

Pro-Voucher legislator blames districts for voucher explosion. I call BS.

I should preface this by saying I served with state Sen. Matt Huffman, R-Lima, when I was in the House -- we entered the House the same year in 2007. I found him a sober, decent man. But he was obsessed with one thing -- making sure as many families sending their kids to private, mostly religious schools got as big a public subsidy as possible through the voucher system.

And wow has he been successful, as I noted a week ago and the Plan Dealer reported today. As the PD reported, these boosts to vouchers will end up coming back and costing us taxpayers even more than the voucher:
"Districts usually receive some state aid for students that use vouchers, even if it is less than what the district has to pay. But when students have never been in the district and never counted toward state aid calculations, (Cleveland Heights-University Heights Treasurer Scott) Gainer said, there’s no state aid for them to help offset voucher costs. 
Local property taxes, Gainer said, are essentially paying for the full $6,000 for most of the new high school vouchers. That has several districts where the same issue is occurring concerned that voters won’t pass school taxes they believe just pay for kids to go to private schools."
What was Huffman's response? Blame the districts. I kid you not. Blame the districts.
"State Sen. Matt Huffman, one of the strongest supporters of vouchers in Ohio, said some of the rules are subtle and have changed a few times. But districts should have known, he said, and should be blaming themselves for not improving their schools. 
He said school officials should just admit to the public: “We knew this was coming for six years. We just didn’t do anything about it.”
This is where I call BS.

How can I do that? Simple: Over the last decade, the state report card grades upon which these new voucher building designations are being based have been deliberately and artificially deflated for the state's school districts. And I'm increasingly convinced it was for this sole purpose: to ensure more districts and buildings are deemed "failing" by the state so more public money can be poured into private, mostly religious schools.

Don't believe me?

Look at school districts' overall grade performance since the 2012-2013 school year -- the first for the A-F state report card system.

Notice anything? Like a massive jump in D and F grades between 2013-2014 and 2014-2015?

Let me ask you a question: Does anyone -- and I mean ANYONE -- actually believe that between the 2013-2014 school year and the 2014-2015 school year school districts became more than twice as likely to "fail" kids?

Of course not.

This is a classic case of grade manipulation by state lawmakers. You'll also notice a steady decline in the rate of Fs since the high point of 2015-2016. Why were these grades so much worse? Because the state kept changing standardized tests. So teachers and students had no idea what the testing expectations were. Since they've remained the same, you can see a steady and precipitous decline in the rate of F grades, though the percentages of D and F grades remain far higher than the 2012-2013 school year.

To add insult to injury, a study examing the test performance of students who take vouchers found they did worse on state tests after taking the voiucher than before ... according to the pro-voucher Fordham Institute. But that doesn't matter to Huffman, whose hero is apparently the Titanic captain who kept plowing ahead, damn the iceberg.

Anyway, here's where Huffman struck gold for those who are taking a public subsidy to send their kids to private, mostly religious schools -- only 2 out of the three years' grades count to have your building designated "failing" from 2013-2014, 2017-2018 and 2018-2019. And once the building is eligible for vouchers, every student who gets a voucher gets to keep it forever, even if the public building becomes the highest-performing in the state.

So when the two buildings in Upper Arlington, or the one in Solon -- two of the highest-performing districts in the state -- invariably stop being eligible for vouchers as they are now, the students who took their vouchers this year can keep getting them until they graduate high school 6-8 years from now -- removing as much as $60,000 in state money from these districts during their time in school.

These districts would have received only about $6,000 total for that student from the state, forcing local taxpayers to subsidize Huffman's Folly to the tune of $54,000 in local property taxes for each student.

So Huffman can keep claiming it's all districts' fault that these vouchers are wreaking havoc on district finances.

But it's all been a plan from the beginning:

1) Deliberately deflate district report card grades

2) Get as many buildings as possible eligible for vouchers

3) Market them like crazy to families in these districts so the rest of us taxpayers can subsidize their choices with our local tax dollars and/or fewer opportunities for our kids who remain in local school districts.

That's not a district performance problem.

It's Huffman's plan.

And has been all along.

Monday, November 25, 2019

It's official: Vouchers explode in Ohio

I was concerned this would happen after the budget was passed, but even I didn't think the absolute explosion that's happened to Ohio's voucher program would happen this fast.

How fast? Try a $47 million jump from last year to this year. Ohio school districts now lose $330 million to vouchers that pay for students to attend private, mostly religious schools. And the school year isn't even halfway complete. Another enrollment period happens after Jan. 1. So we may be looking at $350 million lost to vouchers by the end of this school year.

And this is just the voucher deduction. There a whole other explosion going on in the EdChoice income-based voucher program, but since it's not a pass-through deduction from school districts, it will be more difficult to track.

Despite that, some districts have been absolutely devastated by these increases. Take Scioto Valley Local in Pike County. Two years ago, they lost zero students to vouchers. Last year, they lost $9,720 to vouchers. This year? $103,600.

That's $100,000 that Scioto Valley had coming from the state two years ago that they no longer have. That's a lot of money to Scioto Valley. They only raise $148,000 for every voted mill they put on the ballot.

But it's not good really anywhere. Cleveland's losing another $6 million. Parma $2 million. Middletown $485,000.

And even wealthy suburban districts are getting hit.

Lakota Local in Butler County is losing $403,000 more. Gahanna in Franklin County is losing $355,000 more.

Rural districts are getting hammered too, with some losing more than 400% more money this school year than they did two years ago. And even though it's not millions of dollars, some of these districts only raise a few tens of thousands of dollars for every mill of property tax they can put on the ballot. So in relative terms, these dollar losses can be even more devastating than the millions more lost in some school districts.

What gives? Well, there are now more than 1,000 school buildings who have qualified to be a voucher building, which means at some point in their past or present they received a D or F on one of several report card measures between 2014, 2018 or 2019 (2015-2017 were classified as safe harbor years because of the many testing changes that occurred then).

But it doesn't matter if those buildings had As in everything else. If they received a D or F in two of those 3 years on overall performance, student growth, graduation, or the third-grade reading guarantee, they are now eligible to be a voucher building.

So now you have buildings in some of our state's wealthiest, highest performing districts eligible for vouchers. Like Parkside Elementary School in Solon, which is traditionally a top 5 or 6 performing school district in the entire state. Or Barrington Road Elementary School and Hastings Middle School in Upper Arlington.

These schools are all extremely wealthy. And now, the wealthy parents who send their kids there can qualify for public subsidies to send their kids to a private school.

I know. Crazy, right?

But not really. This has always been the plan. It's why Akron industrialist David Brennan started vouchers in the first place more than 20 years ago. His goal was to get the state to pay every student to attend Akron St. Vincent St. Mary's High School.

It looks like Mr. Brennan, who died last year, will finally get his wish thanks to the millions he and his acolytes spent on Ohio politicians since 1997.

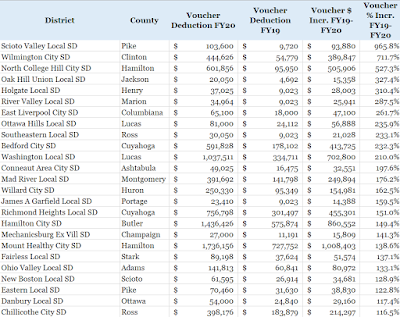
Here are the top 25 districts in the state who have lost the most money between this year and last year to the voucher deduction:


And here are the 25 school districts whose increased deductions to vouchers have increased by the largest percentages between last year and this year:


Thursday, November 21, 2019

Speaker's got a curveball. But is it a good one?

Well, that was unexpected.

During the debate on fixing Ohio's school funding system, much time has been spent poring over the Cupp-Patterson funding plan, now encapsulated in House Bill 305, which had its 6th hearing yesterday in the House Finance Committee.

And while much has also been made of how about 2/3 of the Ohio House has signed onto the bill, one conspicuously absent name is House Speaker Larry Householder, who lives in the same county where Ohio's school funding lawsuit originated.

We finally heard something from the Speaker yesterday and it threw people for a loop. He wants to potentially "redistribute" local revenue to help handle the $1.5 billion (or more) cost of fully funding the plan in HB 305.

While not a new idea (when I first ran for office in 2006, I suggested a statewide property tax to provide the local share of education's base cost), suggesting something like this out of the blue was a bit surprising.

This could be good or bad, depending on how this is done. I'll go through a few of the options and what each could mean for schools and kids.

1) The Brenner redistribution. Remember when now-state Sen. Andy Brenner suggested rolling everyone's local and state money into one pot, then redistributing it to every school, public, private and charter? Yeah, that led to big cuts in school districts and huge increases in charter schools. Couple that with his banning of additional local levies, and you can see why he had only one sponsor hearing on this bill. Householder is most likely not suggesting this.

2) Inside millage. This is something I've heard around for a couple years now. On all our tax bills, there is an automatic 10 mill charge that every property owner in Ohio pays, on top of the voted mills we pay. The inside millage is divided up among schools and local governments. He may be suggesting taking all of those mills and giving it to schools, or taking all the inside millage, sending it back to Columbus and redistributing it back out to school districts. This isn't an awesome idea because it would remove money from local governments (which have already been decimated by local government fund cuts) and agencies to fund schools. But it's much better than Brenner's disastrous plan. He could also be suggesting raising the inside millage to something like 15 or 20 mills and taking the millage above 10 to all go to schools. That would be better for local governments, but would likely be met with stiff resistance in his caucus.

3) Create a statewide property tax for basic education. This would be the best idea -- create a statewide property tax that the state would calculate to provide the local share of the cost of the new school funding plan. That way communities wouldn't (in theory at least) have to vote for more levies to pay for basic needs like books and teachers. Local levies would be used instead to pay for relative luxuries -- 8 years of French, orchestra programs, etc. This is kind of the Holy Grail for Ohio education funding. And it would eliminate the need to use endless levies to pay for education. But I'm not sure that Householder would want to create something like this that would require a constitutional amendment, which requires large numbers of votes in both legislative chambers.

4) Raiding local revenue. It would be a real world problem if his idea is to take a bunch of locally raised and voted on money, then redistribute it to other areas. It's not that the idea doesn't have merit; it's just that I live in the real world and I can't imagine the uproar if local property taxpayers are seeing their voted property taxes going across the state.

We don't know which, or combination of which idea(s) Householder is contemplating here. But he's undertaking a key attack on our unconstitutional funding system -- the overreliance on property taxes to pay for schools. There is no question as a Perry County Speaker, he gets the issue here. And I believe he wants to do the right thing to fix this mess.

If the plan he's talking about would say that the state now has a formula (under Cupp-Patterson) that accurately calculates student need, and it's going to base the local share of funding on a levy amount that doesn't have to be constantly voted on, then it's a good thing.

If he's raiding local revenue from some areas of the state and giving it to others, that creates a whole new set of challenges.

But they're not impossible to overcome. A plan like this is how Wyoming -- the state judged by Education Week as having the country's best, most adequate and equitable funding sytem in the country — pays for its school system. The state of Wyoming takes money from districts that raise more than they need locally and redistributes it to districts that don't raise that kind of revenue.

The problem with doing that in Ohio is we have a long history of keeping local revenue local. Asking our state to change its outlook on locally raised money will be quite a challenge.

So stay tuned...


Monday, October 28, 2019

Too Much Peanut Butter: How the Cupp Patterson School Funding Plan's Base Formula Bakes in Inequity

Image result for cupp patterson bill

What has become abundantly clear during these initial hearings of HB 305 -- the standalone version of the so-called "Cupp-Patterson" school funding plan -- is that the authors seem pretty convinced that the one aspect of the plan that should be edited the least is the base cost portion of the formula.

Proponent testimony on the plan's base cost is scheduled to be heard before the House Finance Committee Wednesday at 9:30 a.m. in Room 313 of the Ohio Statehouse.

What is the base cost anyway? It's how much the state figures educating the state's 1.7 million students should cost. So it takes into account several factors, including teachers, administrators, busing, mental health professionals, athletics, etc.

The ultimate cost of the base funding portion of the formula is $11.22 billion in Fiscal Year 2020.

That's a lot of money.

However, what's clear from the formula itself is that money is spread pretty evenly across all district types. In other words, the poorest districts get about the same base cost per pupil as the richest ones.

That's a problem because even base costs are decidedly not the same across districts.

It's much harder, for example, to find teachers willing to instruct students in small, poor, rural districts like Crooksville than it is in wealthy suburban ones like Bexley. However, under the current iteration of the Cupp Patterson formula, Crooksville receives $3561 per pupil for teachers and Bexley receives $3565 per pupil.

Likewise, Orange City Schools -- Cleveland's wealthiest suburb -- will receive $3,553 per pupil for teachers and Cleveland Municipal Schools will receive $3,570 per pupil -- a 0.5% difference in cost.

Because it's only 0.5% more difficult to teach in Cleveland than Orange? I don't think that's an accurate assessment.

These results mirror the overall result: there is almost no difference in teacher per pupil costs regardless of district type.

School Type Average PP Teacher Funding FY20
Rich Suburban  $                                        3,536
Suburban  $                                         3,561
Small Town  $                                         3,571
Rural  $                                         3,581
Poor Small Town  $                                        3,584
Poor Rural  $                                         3,587
Urban  $                                        3,596
Major Urban  $                                         3,610

This teacher equity issue spreads throughout the current version of the formula. Looking at the total cost, the spread is quite narrow between each school type, meaning the formula sees almost no difference in the base needs at wealthy suburban districts and poor rural and urban districts.

In fact, the lowest per pupil base cost is at Ohio's largest urban districts like Cleveland, Columbus, Cincinnati, etc. Because their needs are so much less? Again, it seems a bit unfair to have these results on the $11.22 billion bulk price calculation for the school funding formula.

This result forces plan designers to rely on the weighted funding (Poverty, English Language Learners, etc.) or dream up exotic distribution fixes to a base cost formula that seems like it's piling on globs of peanut butter without much thought as to whether some districts' bread slices need more or less of it.

School Type Average PP Base Cost
Poor Rural  $                       7,873
Rural  $                      7,998
Small Town  $                       7,520
Poor Small Town  $                      7,420
Suburban  $                       7,282
Rich Suburban  $                       7,278
Urban  $                       7,333
Major Urban  $                       7,263

The authors and proponents of the Cupp Patterson plan have suggested they are open to distribution fixes, meaning adjusting how much of these costs have to be picked up by the state vs. the local taxpayer.

And they should be commended for recognizing that the way these funds get distributed should vary more greatly between the haves and have nots than the formula's initial version.

However, if $11.22 billion of the formula are calculated inequitably, how much of a difference could moving around even $1 billion (as an example) through various additional weights or distribution changes make?

There is a solution: building more equity into the $11.22 billion base cost formula. Doing things like acknowledging that smaller classes in poorer schools helps students succeed, or recognizing the difficulty in attracting talented teachers to the most difficult to staff districts would go a long way toward helping the formula work better at its initial calculation. An added benefit of working more equity into the base funding cost is you would have to be less exotic at the distribution or weighted funding end.

As Chairman of the Primary and Secondary Education Subcommittee of the House Finance and Appropriations Committee, I did this 10 years ago using an index based on poverty, property wealth and education attainment levels that was then applied to these costs, which helped to ensure districts with more needs and challenges were recognized as such by the funding formula from the very beginning.

I'm not saying that using an index is the only way to address the inherent inequity the current base funding formula employs, but it is a place to start, for we must work to improve this thing.

This funding formula is the best shot we'll have for a generation of getting this right, and its authors and working group should be lauded for their Herculean efforts. But it will require mutability of those who have put so much blood, sweat and tears into its drafting, not unlike what those who drafted House Bill 1 10 years ago did.

I know it's not easy. Having gone through exactly what these brave souls have gone through, I can assure them that working on all aspects of their formula, with no sacred cows, can make it work better for all our kids, regardless of where they live.

And that should be all of our goal.

Wednesday, September 25, 2019

New IO Report: More Money for Vouchers, Less Oversight of Charters

I have to admit, I was shocked at how quickly the Ohio Legislature and Governor forgot about the ECOT scandal -- the largest taxpayer ripoff in state history. Because the most recent budget that passed actually loosened regulations on charter schools.

More amazing still is the state's going whole hog in on Vouchers for families making as much as $100,000 a year. Just an unrelenting pursuit of the public funding of privately run schools. We've put out a new report at Innovation Ohio that details many of these provisions. But here's the most striking chart in the whole thing, as far as I'm concerned:

That's right. The average per pupil funding of private school students -- many of whom never really attended Ohio's public schools -- is now almost $2,000 more per pupil than the what the 1.7 million students in Oho's public school system receive.

Remember that in the landmark Zelman U.S. Supreme Court case that ruled Ohio's Cleveland voucher program constitutional, then-Chief Justice William Rhenquist said it was not a violation of the constitution's Establishment Clause because in large part the program was deisgned to help students in failing schools and the per pupil amount was a pittance compared with what public school students received from the state.

Now that 95 percent of Ohio school districts lose at least some funding to private school vouchers and the average per pupil funding for these programs far outstrips the average funding for public school students, it's right to wonder whether the current Ohio voucher program would meet muster under the Zelman decision.

Friday, September 13, 2019

Charter Schools' Overrepresentation of Failure, Underrepresentation of Success

Every time I write about the state report card, I do so with some trepidation because I don't think they're a true barometer of success, as I've said on many occasions. However, I do believe they can show us general trends about 50,000 foot views on students success.

In this vein, I'd like to point out one extraordinary thing from yesterday's release of the state's new report card: Ohio's charter schools, which represent about 10 percent of Ohio's school buildings, make up about 40 percent of Ohio's school buildinsg that received overall F grades.

Factoring out charter schools shows that among the 3,029 non-charter school buildings made up the remaining 208 F buildings, or not even 7 percent of Ohio's public school buildings. Ohio's charter schools? A full 36 percent of them received overall F grades.

But even the degree of F grades are striking. Of the 45 Performance Index percentages that are below the 33rd percentile, 35 are charter schools, which means about 10 pecrent of all charters are below the 33rd percentile on Performance Index scores -- the state's index of proficiency.

Of the 71 school buildings that received zero gap closing points, 45 were charter schools, which means that nearly 13 percent of all charters received zero points for closing achievement gaps.

The opposite trend continues on the positive end -- few charters occupy top performance positions.

Of the 281 buildings that received A grades for Performance Index, only 9 were charter schools. Again, charters are about 10 percent of all buildings, but only are 3 percent of the top scoring buildings on proficiency.

Meanwhile, of the 1,144 school buildings that received an A on Gap Closing, only 40 (3.5 percent) were charter schools, which means only about 11 percent of Ohio charter schools rank among the state's best schools for closing achievement gaps.

Shall I continue?

Needless to say, it should concern many that Ohio charter schools dominate the bottom rankings among Ohio's school buildings and appear only 1/3 as frequently as their numbers suggest they should on the top end of the performance scale.


Thursday, September 12, 2019

New Report Cards tell Similar Story

The new state report cards are out and they tell a lot of the same story they always have, namely Ohio's public school districts outperform Ohio's charter schools in nearly every way. Again, nearly all Ohio school districts lose funding and students to Ohio charter schools. So this isn't just an urban question.

Overall, two-thirds of Ohio school district grades are A, B or C. Two-thirds of Ohio charter school grades are D or F.

Meanwhile, Ohio’s local public school districts receive As in Gap Closing between disadvantaged students and those without disadvantages at three times the rate of Ohio's charter schools, had a 20 percent better rate of As in student growth and even outperformed charter schools in charter schools’ best-performing measure – student growth among the lowest-performing students.

Ohio charter schools had a stunning 93% rate of F grades in meeting performance benchmarks and nearly half of all Ohio charter schools received F grades in closing achievement gaps between the most at-risk students and those who are more advantaged. Perhaps the greatest difference can be seen in Performance Index performance (the one number that encapsulates overall proficiency) where 43% of charter schools received an F grade and only 6 of Ohio’s 608 school districts received an F.

As for school districts, they improved their percentage of As in 8 of 14 graded categories and lowered their rate of Fs in 11 of 14 categories. The biggest area of improvement came in graduation rates and closing achievment gaps. However, their biggest drop off was in student growth where last year nearly 1/2 of all districts received As. This year, only 13 percent did. We'll have to look at that more closely to discover why.

Only 4 districts received overall grades of F this year -- at 0.7%, a far better rate than Ohio charter schools' 28%. However, one of those 4 is Youngstown, which is under the Academic Distress Commission. This means that the district will now have to transition to a mayor-appointed academic distress commission Jan. 1 through a complicated process. So that's another issue that could perhaps be fixed through the apparently fast-moving distress commission reform now being discussed in the Ohio Senate.

But overall, Ohio's districts are improving in far more measures than they are slipping, and the continued strong showing in closing achievement gaps is encouraging.

However, this is where I reiterate again that these report cards are almost singularly reliant on scores earned on standardized, high-stakes tests that are notoriously tied to poverty. So while we're seeing improvements, the fact remains that the poorer your students, the less successful you will appear on this report card. That has always been true and will likley be true as long as tests that are taken for a few days during the year and are great at measuring poverty continue to be used to judge the 180-day educational experiences of children.

Sunday, March 31, 2019

No Han Solo: What’s missing in Ohio’s newest school funding attempt


When the long-awaited school funding simulations were released Friday by state Reps. John Patterson, D-Ashtabula, and Robert Cupp, R-Lima, for their Fair education funding plan, people didn’t really know how to respond. Yes, it called for an annual spending increase of $718 million statewide for schools.

That’s good.

But did Ohio’s suburban districts need to swallow up more than 1/3 of that increase while the state’s biggest urban districts only got 5 percent of the increase? And flat funding Northern Local in Perry County – the district that originally sued the state over its failure to properly fund education? How is that “fair”, as the plan’s authors claimed?

Something didn’t seem right. The formula Cupp and Patterson talked about made sense. Figure out what students need. Then fund it. The elements they picked (teachers, mental health, etc.) all made sense.

So why were wealthy, suburban districts getting more than 1/3 of the increase?

One explanation is that Ohio has held down increases in suburban districts through so-called “gain caps” for years.  This allowed the state to continue investing in districts that couldn’t raise local revenue – not enough state investment there, by the way, but this Robin-Hooding has happened for decades.

So if you’re eliminating gain caps – one of the hallmarks of the Cupp Patterson plan – you’re going to see large increases in districts that have been capped for years. In many ways, you are essentially making up for 30-40 years of Robin Hooding.

But the issue is more complicated than that.

Ten years ago, I was in the exact same position as Cup and Patterson. I was the chair (they are co-chairs) of the Primary and Secondary Education Subcommittee of the House Finance and Appropriations Committee when then-Gov. Ted Strickland introduced the Evidence Based Model of school funding – the state’s first real attempt to cost out education and pay for it since the Ohio Supreme Court ordered the state to do so in 1997.

In much the same way as Cupp-Patterson, the original EBM initially poured millions into wealthy, suburban districts while doing much less, relatively speaking, in poorer districts.

Yet by the time the formula left the House and eventually became law for a couple years, the plan did the best job of distributing revenue to the most needy districts the state had ever seen. And it won the prestigious Frank Newman Award from the bipartisan Education Commission of the States.

What happened?

We found Han Solo.

Let me explain.

I have always contended that the reason the Star Wars prequels failed to garner the widespread love of the original three was because the second prequel didn’t have Han Solo (or a character like him) – a wisecracking, street smart character who didn’t quite buy all this Jedi/Force/Destiny stuff. He was grounded in the real world. He was the guy audience members who weren’t buying the magical part of the movies could relate to.

You didn’t need to believe in the Force to believe in Han Solo. Because Han Solo was us.

Back to school funding.

The EBM’s Han Solo was the Education Challenge Factor – an index that calculated a school district’s extra-curricular challenges (and I don’t mean football teams). It took into account a district’s relative poverty and its parents’ educational attainment level – what we’ve known for years is the single most important determinant of a student’s success. Those were merged into a number that we applied to many of the formula elements.

 Why did we decide to apply the ECF to the formula elements? Because it’s hard to find, for example, teachers who want to teach in districts where the parents don’t value education that much and will more likely impede than support  learning. Likewise, it’s easier to find those teachers in wealthier districts with more supportive parents. We applied it to many of the other formula elements, but that's the reason why. It's generally harder to overcome poverty and other barriers in districts with more of it.

The ECF did a lot of the heavy lifting for the EBM – leveling out a lot of the original inequities in the formula.

The Cupp Patterson formula doesn’t have a similar mechanism to account for the more difficult challenges districts that are poor and whose students don’t have much support from parents face in finding talent and overcoming those barriers, especially in districts that are the most challenged.

So, for example, the Cupp Patterson plan assumes it will be just as easy to find the mental health professionals the formula envisions in Olentangy, Cleveland and New Boston. And those professionals will be equally successful in all those places.

That’s probably not an accurate assessment.

What effect would the ECF have on the Cupp Patterson plan? I’m not going to use dollar figures here because I don’t know which elements of the formula the authors would want to apply it to. And I’m using ECF figures from 10 years ago. I don’t want to suggest that Cupp and Patterson have to figure out how to find even more money than they currently have. 

However, what I can do is show how the distributions work under the current Cupp Patterson plan and how it would work if you applied the 10-year-old ECF to all of a district’s funding (which is not how it would work, but this is just an exercise). Here’s the result: